There are several simple ways to color pLDDT (predicted local distance difference test) values of the AlphaFold2 (AF2) structures. I am showing a few examples using either PyMOL or ChimeraX.
Note: the pLDDT values are the b-factor column in PDB
Here is one view of USP4 generated from AlphaFold Protein Structure Database
Here are some examples using PyMOL
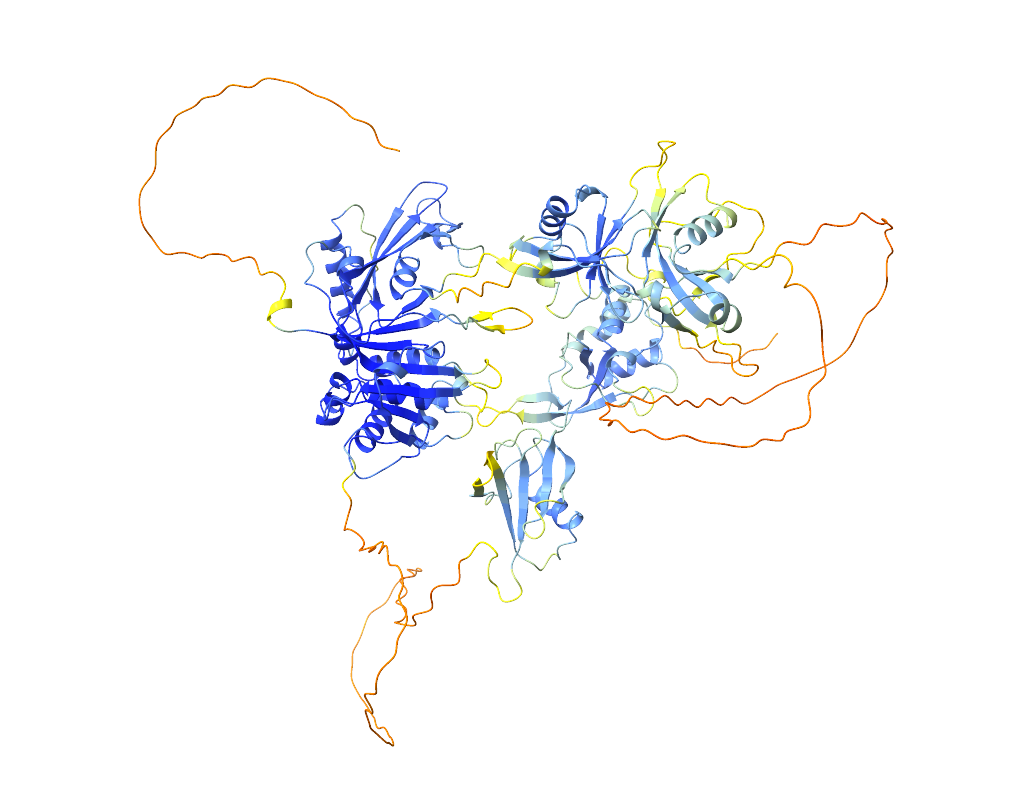
spectrum b, red_yellow_blue, minimum=0, maximum=100
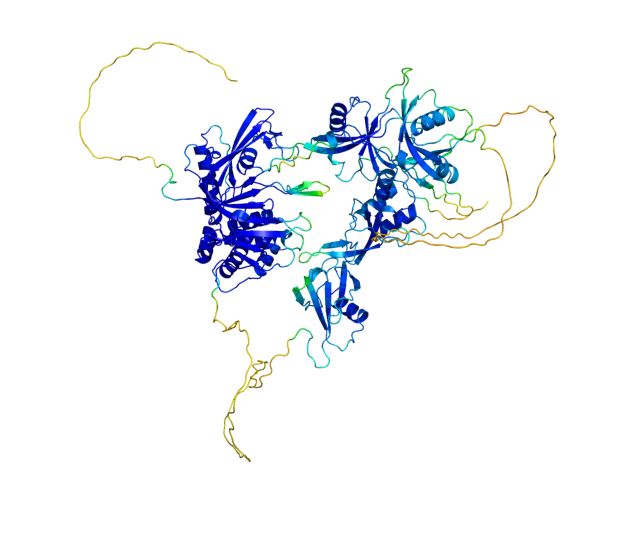
spectrum b, red_yellow_green_cyan_blue, minimum=50, maximum=90
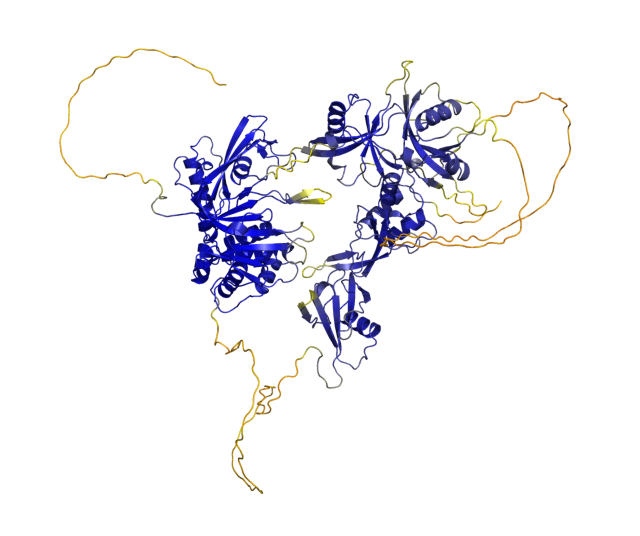
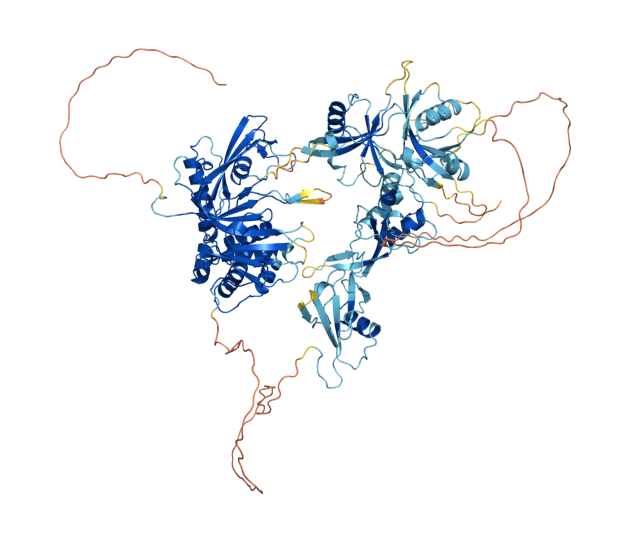
Using AlphaFold2 colors (from https://github.com/sokrypton/ColabFold)
set_color n0, [0.051, 0.341, 0.827]
set_color n1, [0.416, 0.796, 0.945]
set_color n2, [0.996, 0.851, 0.212]
set_color n3, [0.992, 0.490, 0.302]
color n0, b < 100; color n1, b < 90
color n2, b < 70;  color n3, b < 50
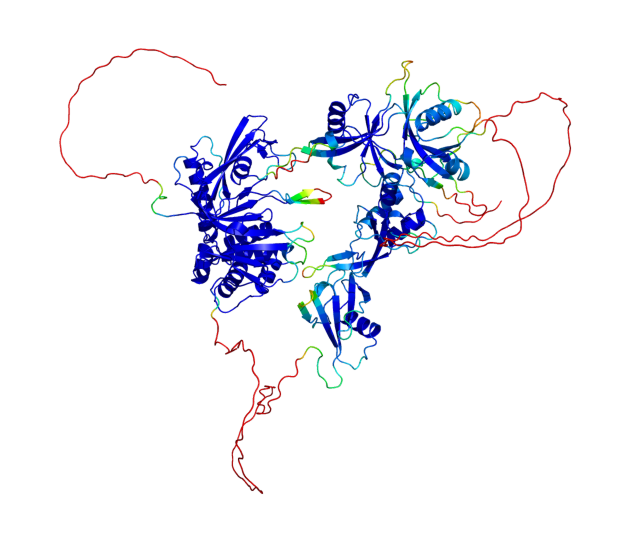
spectrum b, rainbow_rev, minimum=0, maximum=100
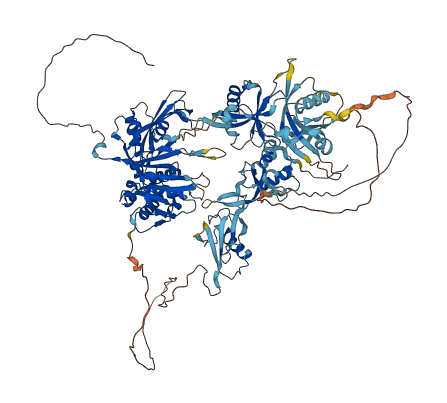
It’s much easier to color AlphaFold2 color codes in ChimeraX:
color bfactor palette alphafold