We recently bought two Mac Mini with new apple M1 chip. Although Apple provide seamless simulator Rosetta 2 for Intel-based software, I wonder how the performance of new Apple M1 chip dose. So here is a simple test using Phenix and one crystallographic dataset collected in my lab. We also compared the computation speed between Mac and Linux, Desktop PC and Xeon workstation. This is not a professional benchmarks but a reference of some structural biologists to evaluate whether switching to M1 chip is a good decision. I hope open source programmers for structural biology will provide M1-based versions too. If Apple’s GPU can be used for computation, then we really don’t count on no-where-to-buy Nvidia GPU cards at all.
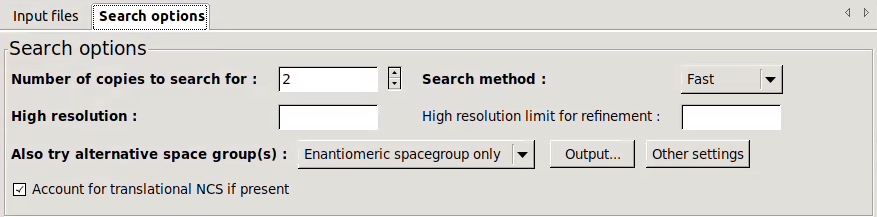
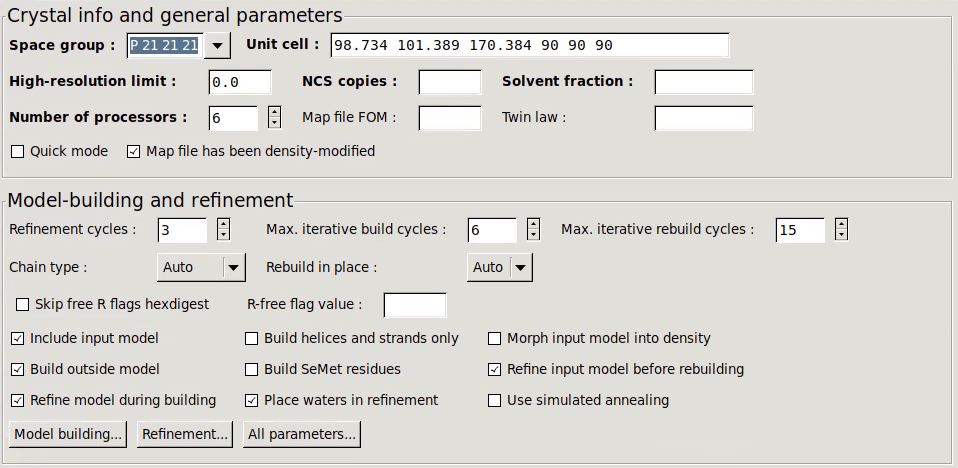
We use a HKL2000 indexed sca file (1.68 Å) and a PDB template for “molecular replacement” first. Phaser (version 2.8.3) with simple mode was used. The phased data was then sent to “Autobuild” using 6 parallel threads (actually only need 5). The best fitted auto-built model was submitted to “refinement” to refinement structures.
Here are the 5 different computers including desktop, laptop and workstations used for comparison. To be noted first, due to varied purchased time, I don’t use same Phenix version (1.17 to 1.19) to do all performance benchmarks.
| Linux-1 | Linux-2 | Macbook Pro 2018 | Mac mini M1-2021 | Mac mini -Intel 2019 | |
| OS | Ubuntu 18 | Ubuntu 16 | Mojave, 10.14 | Big Sur, 11 | Catalina, 10.15 |
| CPUs | Intel i7, 3.2GHz | Intel Xeon silver, 2.2GHz | Intel i5, 2.3GHz | Apple M1, 3.2GHz | Intel i3, 3.2GHz |
| cores | 6 | 12 | 4 | 4 | 4 |
| threads | 12 | 24 | 8 | 8 | 8 |
Below are snapshots of parameters used for Phaser (simple mode), autobuild and Refinement

The benchmarks are shown here.
| Linux-1 | Linux-2 | Macbook Pro 2018 | Mac mini M1-2021 | Mac mini, Intel-2019 | |
| Phenix | 1.17.1-3660 | 1.17.1-3600 | 1.18.2-3874 | 1.19.2 | 1.18.2-3874 |
| Phaser (seconds) | 622 | 1046 | 604.5 | 3677-3900 | 533 |
| Autobuild (minutes) | 241 | 373 | N/A | 320 | 440 |
| Refinement (seconds) | 1334 | 2362 | N/A | 2470 | 3150 |
Few facts regarding the benchmarks and my observations.
- All Phaser tests returned consistent results that a single solution with LLG values greater than 65,000.
- The Phaser in Apple M1 is unknowingly slow. I did 3 times and the programs took 3600-3900 seconds to perform molecular replacement. I don’t know whether it was version differences of Phenix or M1 Rosetta2 simulation.
- In order to check whether Phenix 1.19.2 slows down Phaser, I installed Phenix 1.19.2 on the Linux-1 (Ubuntu 18), it took 600.2 seconds to finish molecular replacement. So it is unclear how Phaser on M1-based mac mini processes slowly.
- Autobuild always returns well built chains A and B. No significant differences between 5 test platforms. The Rfree and Rwork are always around 0.19 and 0.17, respectively.
- Autobuild performance speeds were similar at all 5 platforms. Xeon CPU has slower wall clock rates and it is indeed slow to do autobuild compared to Intel i7 desktop-grade CPU. Mac M1 seems to be a good replacement of Intel-based Mac products. Perhaps when more and more ARM-based native scientific programs written, the power of M1 chip will be more enhanced.
- The Refinement fine tunes structural quality to 96-98% favored dihedral angles in Ramachandran plots, no Cbeta outliers, no cis/twist residues, no rotatmer outliers. Molprobity clash scores are 3-5.
