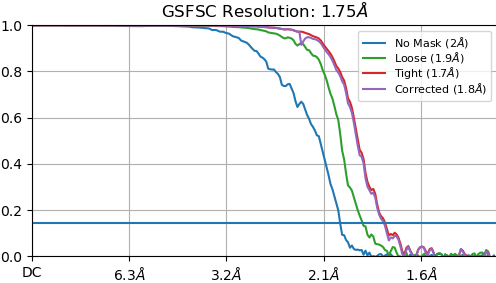
Recently, my group collaborated with the Academia Sinica CryoEM center team to collect and process a set of apoferritin using an equipped K3 detector on our Titan Krios. I don’t have the detailed settings yet, but I am super excited about the resolution. The new 1.75 Å cryoEM map of apoferritin, compared to a 1.86 Å apoferritin map collected on the same Titan Krios using a Falcon III detector, is the new record in Taiwan, demonstrating the capability of high-quality cryoEM data acquisition using currently installed hardware.
A total of 3542 50-frame micrographs were collected under a super-resolution mode (pixel resolution is 0.33 Å/px). We processed the whole dataset using cryoSPARC 3.3.2 on an in-house GPU workstation equipped with 4 Nvidia RTx 3090 24GB cards. After multiple rounds of selection including (1) CTF resolution < 3.5 Å, (2) 0.3 µm < defocus < 1.3 µm, (3) ice thickness < 1.08, (4) particle picking power > 100 and (5) defocus tilt angle <10˚, we got >1500 high-quality images yielding 685,630 apoferritin particles.
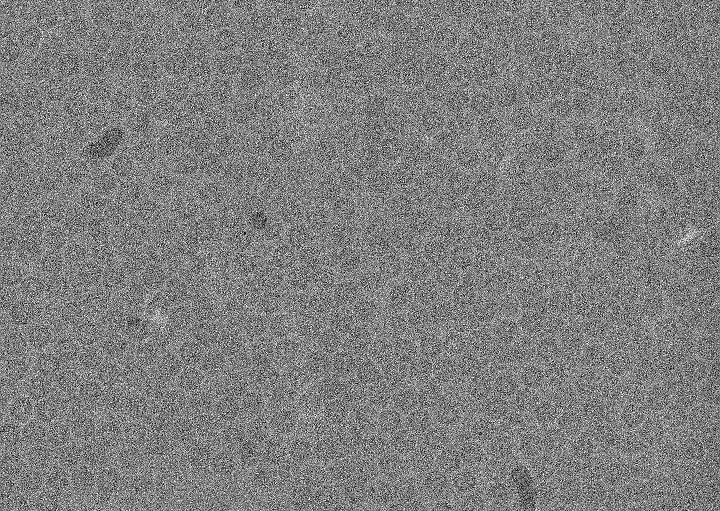
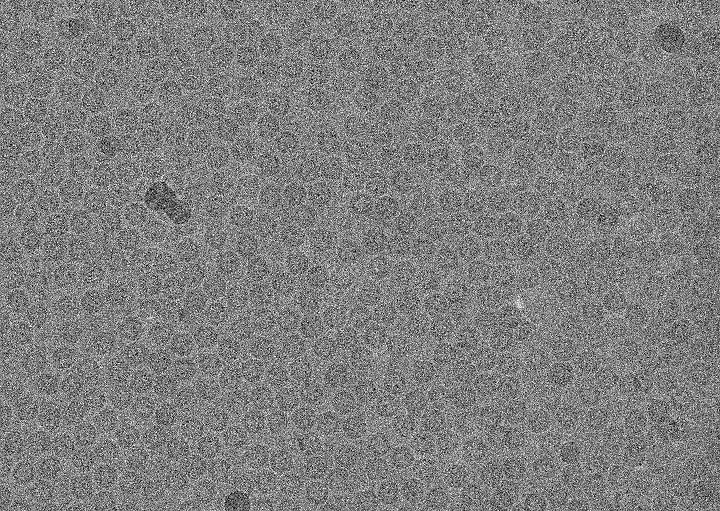
Below are examples of defocus values of 0.3 (left) and 0.5 µm (right). At 0.3 µm defocus, particles remain clear and suitable for picking by cryoSPARC template picking.
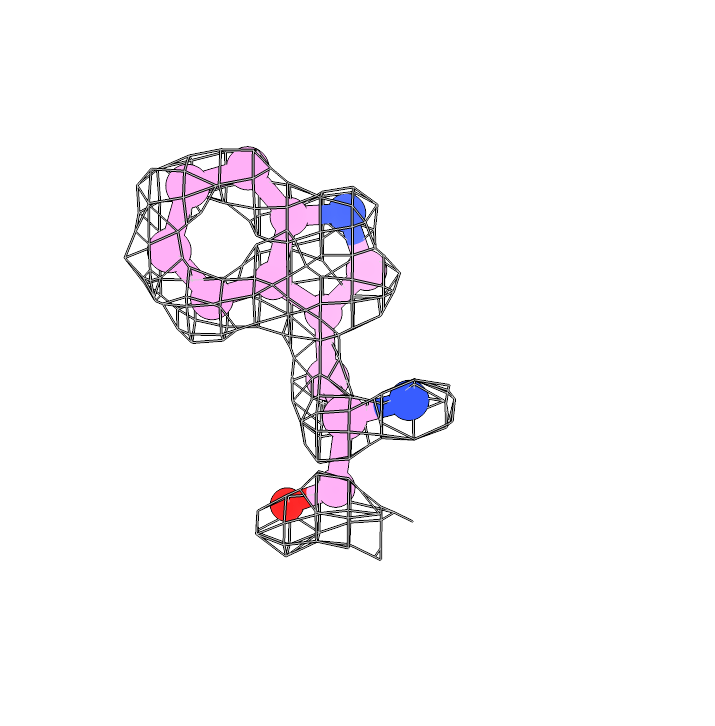
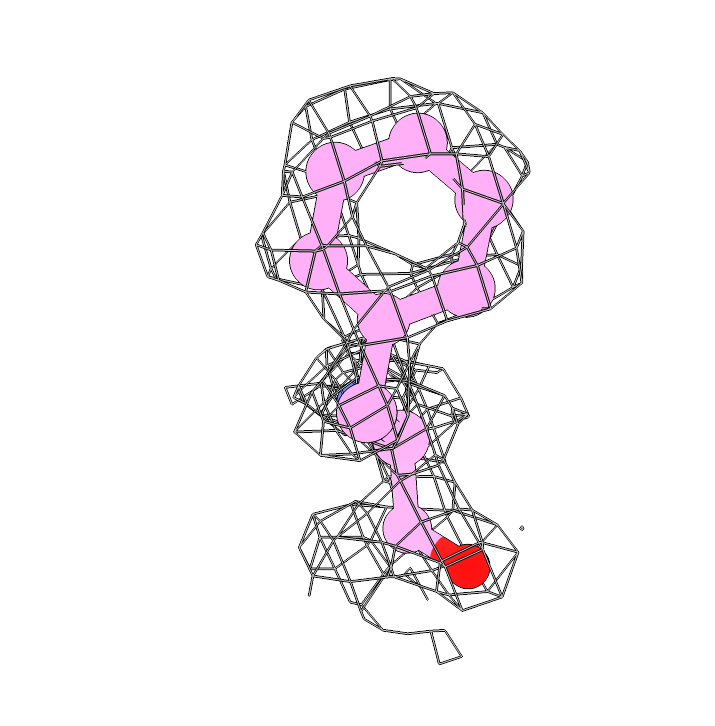
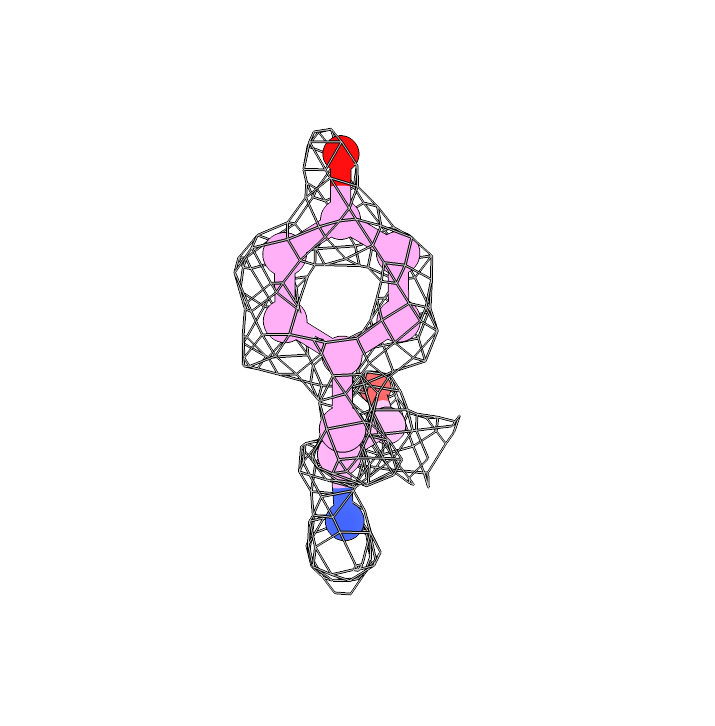
The 680K particles were extracted at 0.66 Å with a box size of 480 for 3D refinement. By using cryoSPARC homorefinement (and NU-refinement, too) with per-particle corrections, we got a 1.75 Å map. The holes of aromatic sidechains, including tyrosine, phenylalanine, and tryptophan, are clearly found on our map. Here are three examples: F55, W93, and Y168 are well assigned in the 1.75 Å map and the aromatic holes are clear.
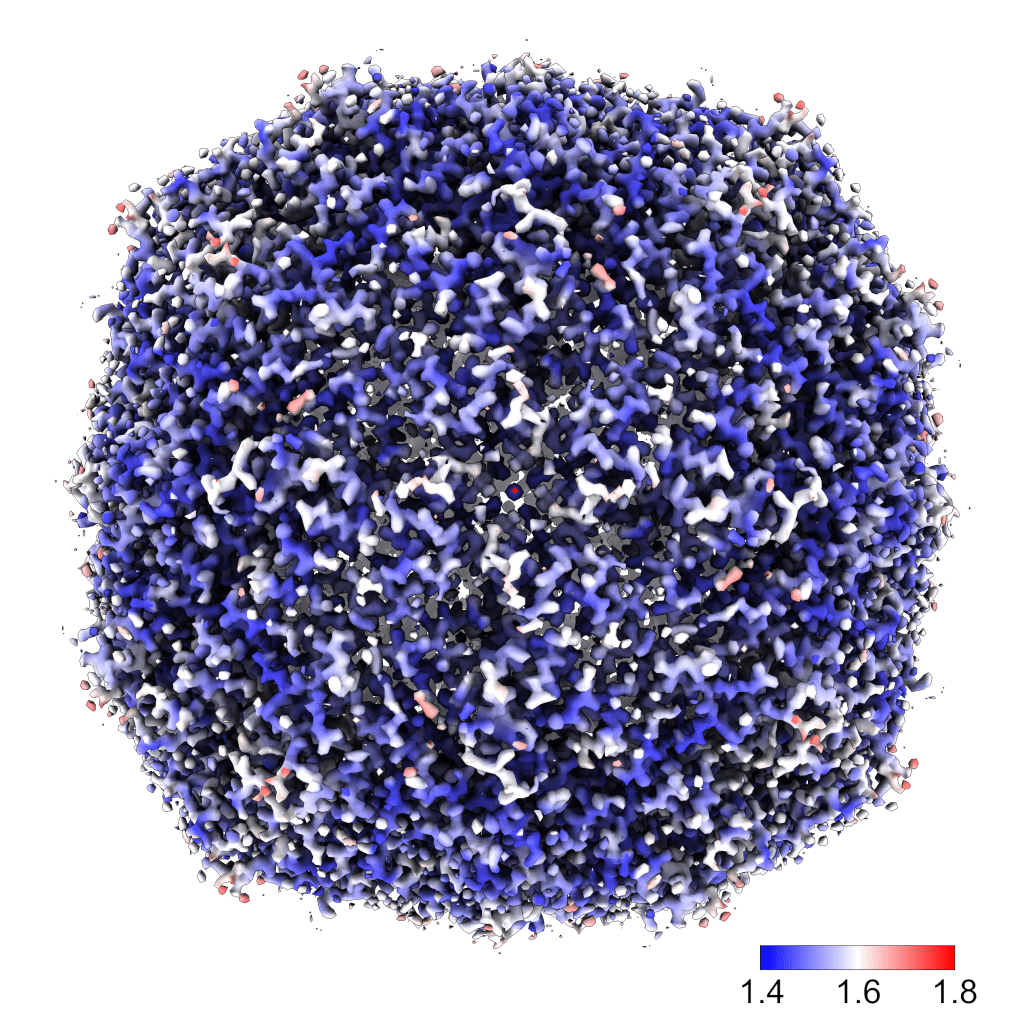
The local resolution estimation below further presents that most regions are below 1.6 Å. The data process was performed entirely by cryoSPARC, which was superb rapid. In less than 24 hours, we got the high-resolution map for benchmarks.