In CryoSPARC, we can download the calculated FSC plot in PNG or PDF format for presentation. I saw few times that users directly used the cryoSPARC-generated FSC plots for publications. In addition to the PNG/PDF format, there is also a TXT file for users to replot the FSC curves.
The txt file has few columns, looks like this snapshot below:
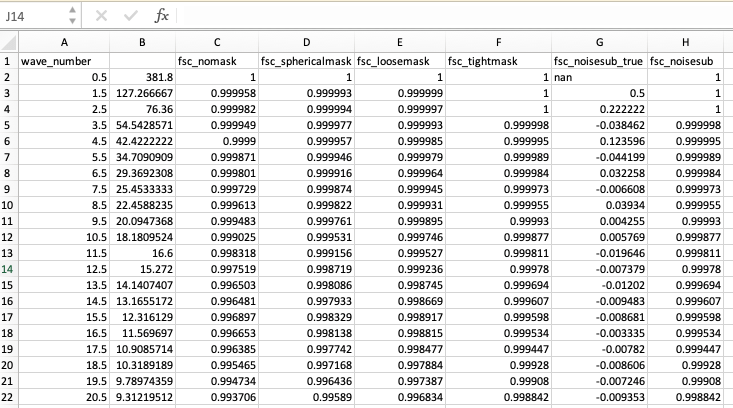
There is no “resolution” column in the text file. To convert the “wavenumber” to “resolution”, here is the equation (provided by the author, discussion at here)
resolution = ( pixel size * box size ) / wavenumber
resolution in A, pixel size in A/pix, box size in pixels, wavenumber is unitless
The column “B” in the figure above is the resolution values I converted.
