Most new PyMOL users like to color the protein/DNA/complex object with multiple colors. The convenient way is using the “spectrum” function to have “rainbow” colors for the object. The rainbow color begin with blue at the N-terminus to red at the C-terminus.
Here is a step-by-step example to have “rainbow” color, using SARS-CoV-2 Papain-Like protease determined by my group (PDB ID: 7D47).
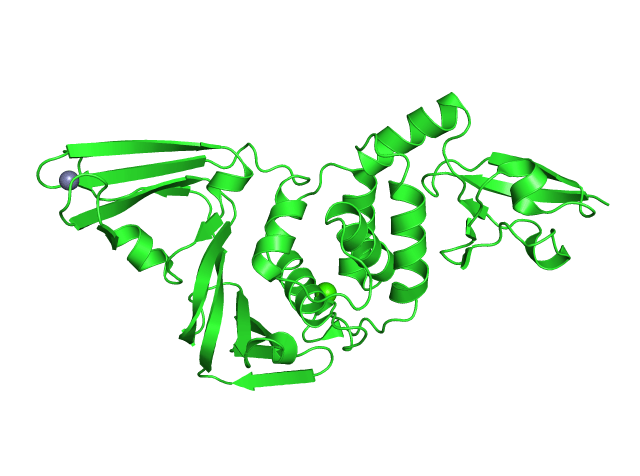
Above figure shows the default color and secondary structure presentation by PyMOL 2.0 or newer. The default color is green, ions are illustrated in separate colors (here: gray: zinc, green: calcium).

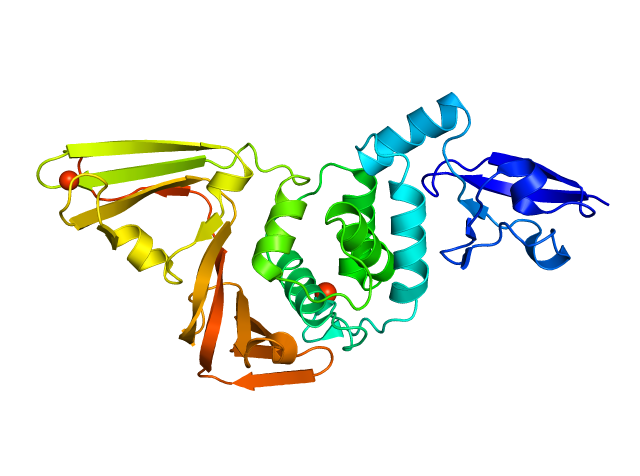
PyMOL provides coloring function on right of object panel. We can choose “spectrum” and “rainbow” to have whole protein (object) colored like the figure below. N-term is blue, C-term is red and middle colors vary..
There are advanced ways to illustrate objects in user-defined color scheme using “spectrum” command. I am showing several examples below and the colors, in particular gradient colors, are very useful to present research works.
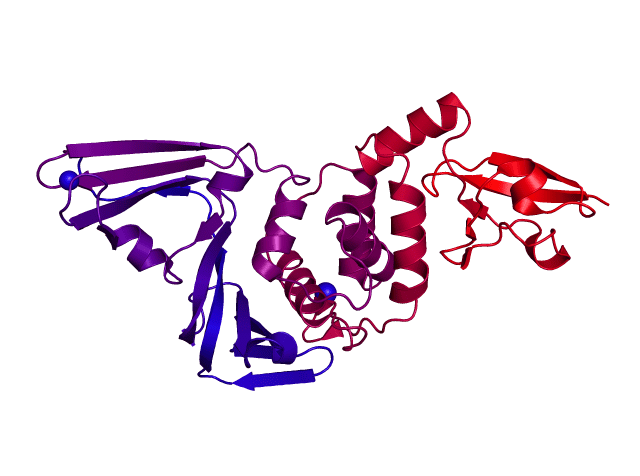
command: spectrum count, red blue, 7D47.
Two colors are chosen, red and blue. From N-term to C-term of the object.
command: spectrum count, red green white cyan lime forest orange blue, 7D47
8 colors are chosen to color the papain-like protease. The colors are distributed from the first to the last residues evenly.

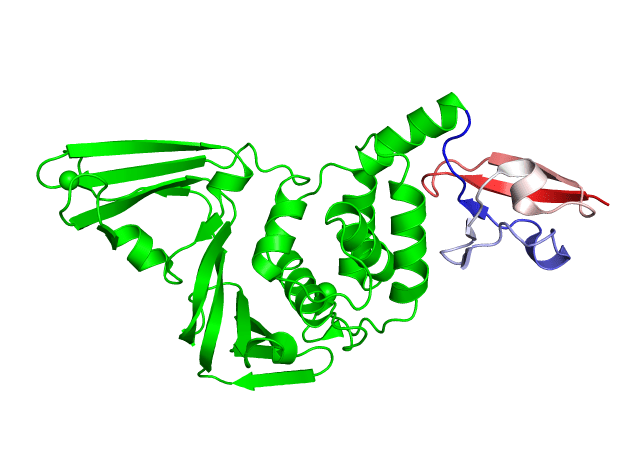
command: spectrum count, red white blue, 7D47 and resi 1-60
Use red to white to blue to present gradient colors for a selected region (residues 1 to 60). Others are not affected.
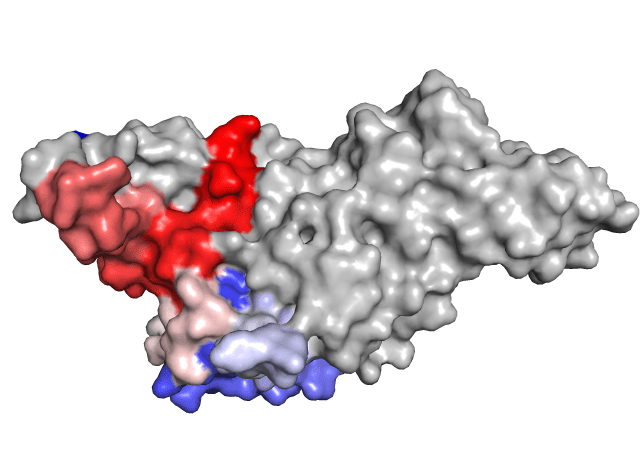
command: spectrum count, red white blue, 7D47 and resi 200-350
One also color the object in other modes. At here, I color residues 200 to 350 from red to white to blue in the surface view. The other regions were first colored in gray90.