PyMOL has some presets for illustrating molecules in different ways including simplified backbone trace, technical view for polar (hydrogen bonds?) contacts, pretty views, publication view and regional dynamics (using b factor column in PDB file).

Above snapshot shows location of “Preset”, PyMOL users can click “A” (action) of molecule object and move mouse cursor to “preset”, several pre-defined illustrations are provided in PyMOL. Examples of some presets are showing below.
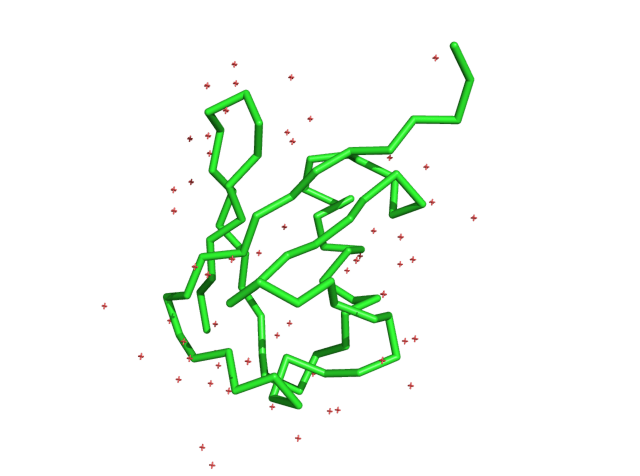
Above is “simple” in preset, it simply draw backbone trace of target molecule.
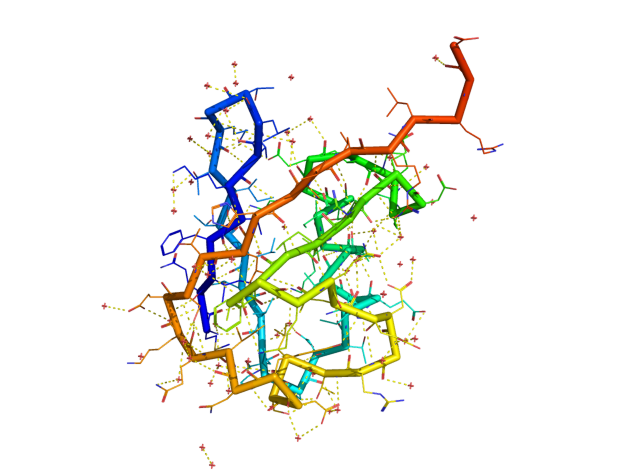
When choosing “technical”, polar contacts will be calculated. The “dashed” yellow lines are polar contacts correlated to generated objects “xxx_pol_conts” xxx is the object name. Sidechains of residues involved in polar contacts will be shown (line view) in addition to backbone trace (in stick view). The color scheme is “rainbow” where N-terminus is colored by blue and C-terminus is colored by red, residues in between 2 termini are rainbow color gradients.
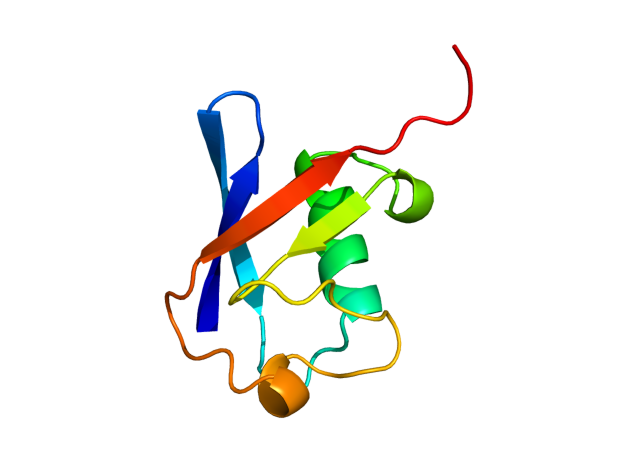
Pretty in “Action -> preset” will show molecule in cartoon with rainbow colors. Thus secondary structures are shown in helices and strands.
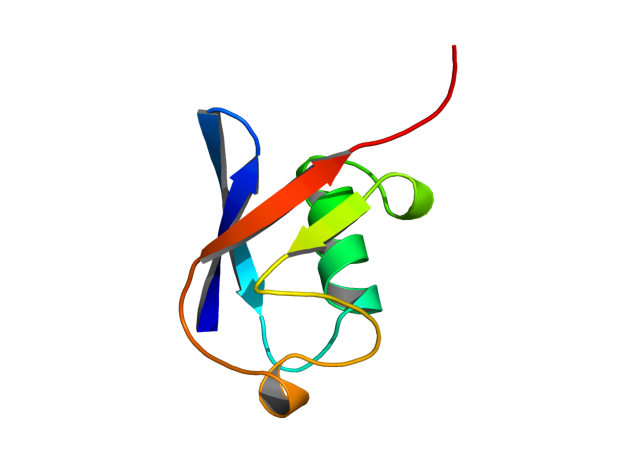
Publication function will make all loops “smooth”. If there are a lot long and disordered loops, it may help to “clean up” some regions. My personal opinion is that “publication” simplifies too much structural details.
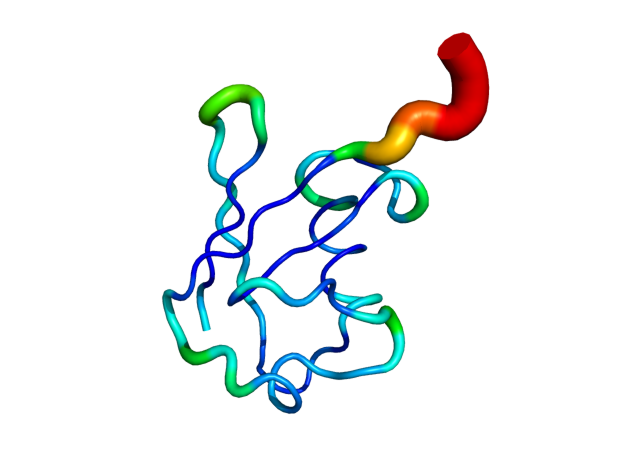
Crystal structure has so called “B factor” in the PDB files and sometimes we can replace B factor column by sequence identities, NMR dynamics or other measurements. (detailed explanation of B factor can be found at Wikipedia). Putty is useful to represent such information and it will generate “sausage-like” tube of molecule. The wider and reddish sausage suggesting higher B factor compared to thin and blueish sausages.
There are more parameters available for putty:
cartoon_putty_quality, cartoon_putty_scale_min, cartoon_putty_radius, cartoon_putty_scale_power, cartoon_putty_range, cartoon_putty_transform, cartoon_putty_scale_max
