To color individual subunits in cryoEM map by Chimera, I often used 2 ways.
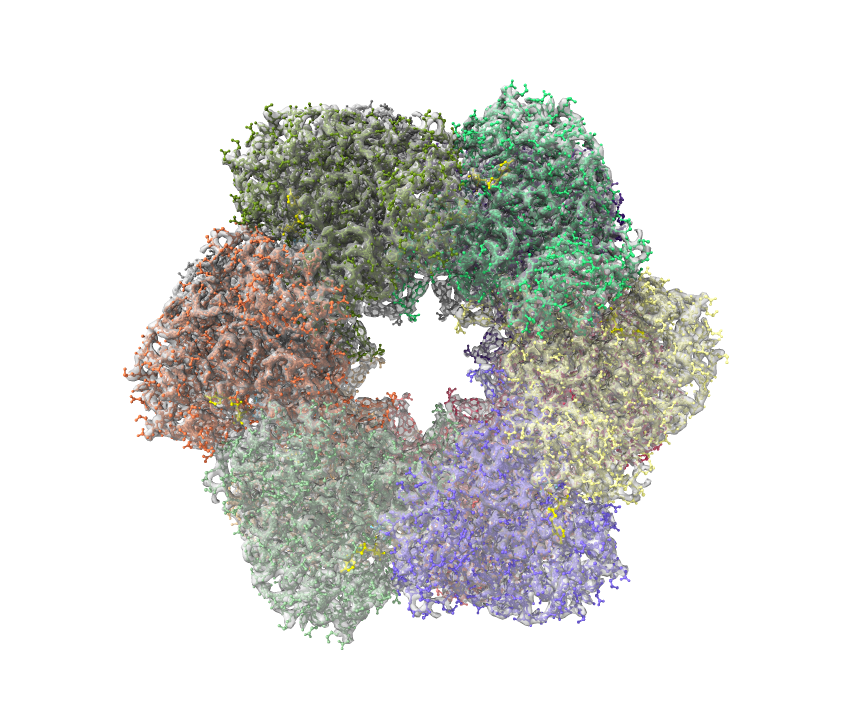
The first and simpler way is to overlap model PDB file and cryoEM map, choose 70-80% opacity. Since chimeraX automatically colors individual chains and ligands, the transparent map will be “colored”. This is a simple way but not very elegant to show for publication.
The second way is actually easy to do. Just need to type one more command. At here, the PDB model is overlapped or docked to map. Make sure use followed command to align pdb to map well:
fit #1 inMap #2
(#1 is PDB, #2 is map).
Then, run the next command:
color zone #2 near #1 distance 2.5
(#2 is map, #1 is PDB, color distance is 2.5 Å).
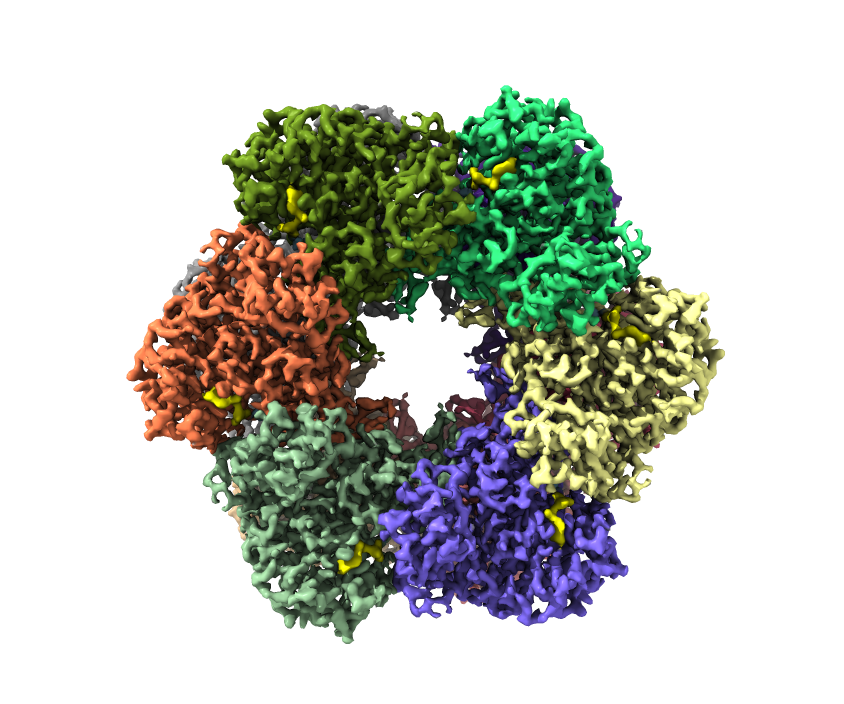
By this way, no need to make map partially transparent. Skip displaying PDB model also make the map clearly with depth. This is a better way to display map with individual subunit/elements, especially the model has some loops not matched to cryoEM map. In this example case, the yellow density is ADP which is clearly depicted.
