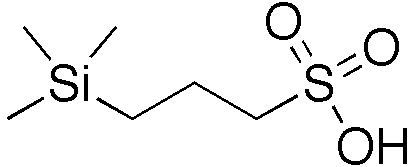
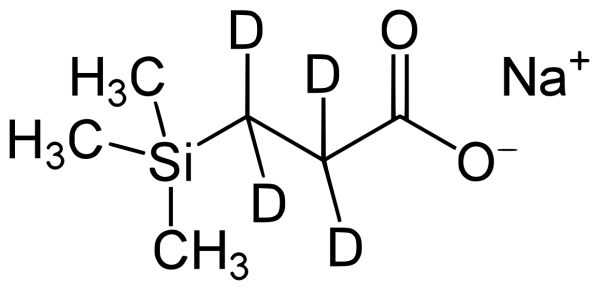
The chemical shift calibration of NMR spectra is very important to provide standard reference for different experiments. The calibration method has been published for decades (Journal of Biomolecular NMR, 1995, Methods in Enzymology 2002). Following the published protocol, we here use sodium trimethylsilylpropanesulfonate (DSS, (CH₃)₃SiCH₂CH₂CH₂SO₃⁻Na⁺) or trimethylsilylpropanoic acid (TMSP or TSP) to collect 1H spectra at different temperatures to obtain the “shifted” values of DSS (or TSP) at 0.0 ppm. For TSP, we often use the deuterated 3-(trimethylsilyl)-2,2,3,3-tetradeuteropropionic acid or TSP/TMSP-d4 to eliminate the unnecessary methylene group. The chemical structures of DSS and TSP-d4 are shown below.
The 13C and 15N calibration can be referenced indirectly based on the frequency ratio and calibration offset. The equations for 13C and 15N calibrations are:
13C-SR =𝚵c x (1H-SR + 1H-BF) - 13C-BF
15N-SR =𝚵N x (1H-SR + 1H-BF) - 15N-BF

𝚵c=0.25144953
𝚵N=0.101329118
(note: 𝚵 = Xi, pronounced as "sai", Greek letter)
Where SR is the shift values of desired nuclei, 𝚵c and 𝚵N are the ratios of 13C/1H and 15N/1H, respectively, and 1H-BF, 13C-BF, 15N-BF are the 1H, 13C, and 15N carrier frequencies of spectrometer, respectively.
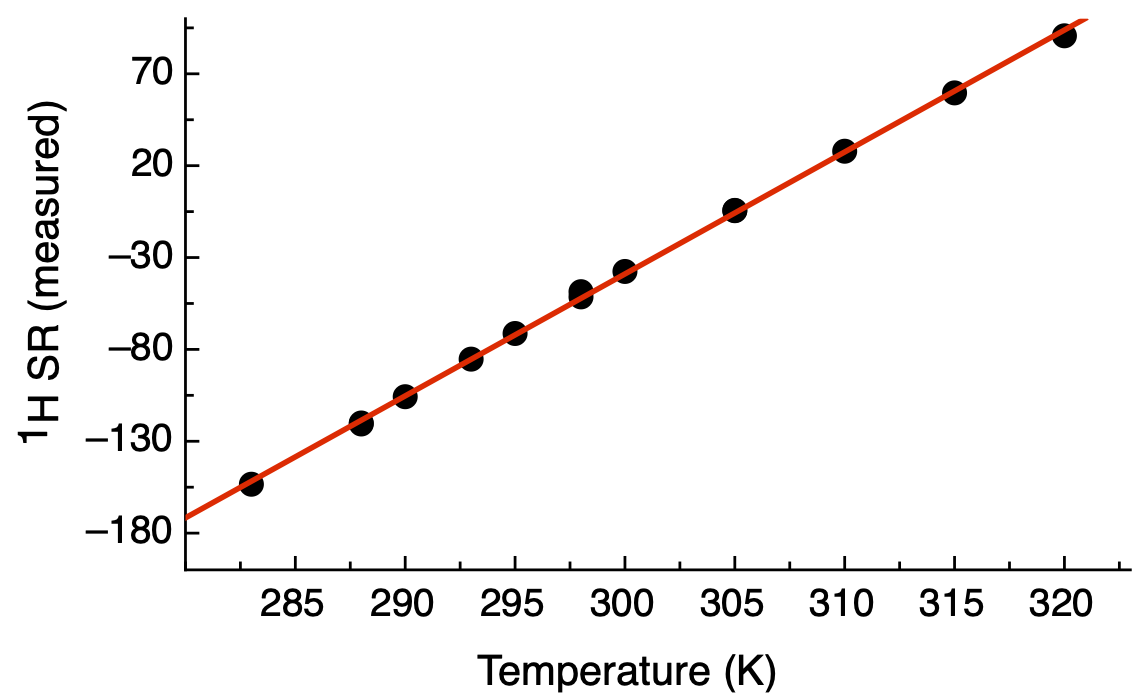
In the Academia Sinica High Field Magnetic Resonance Center (HFNMRC), I recently measured the TSP 1H shifts at 14 different temperatures on NEO600 and NEO850. The data was fitted the equations for the two spectrometers to represent the temperature dependency of 1H reference frequencies.
NEO600:
Y = 6.6375 X - 2030.1862

The R2 and correlation coefficient of this linear regression fitting are 0.9994 and 0.9997, respectively.

NEO850:
Y = 9.4486 X - 2886.9000

The R2 and correlation coefficient of this linear regression fitting are 0.9994 and 0.9997, respectively.

Where X and Y are temperature (Kelvin) and the calibrated values of 1H in Hertz.

The carrier frequencies of NEO600 and NEO850 are listed below
| Nucleus | NEO600 (Hz) | NEO850 (Hz) |
| 1H | 600130000 | 850330000 |
| 13C | 150902808.5 | 86163190.6 |
| 15N | 60810644.8 | 213815648.6 |
Based on the fitted equations and the magnetic fields of spectrometers, we can derive the calibrated values of 13C and 15N of the two spetrometers.
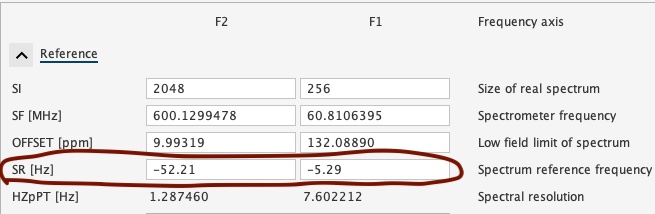
For NEO600 and NEO850, here is the commonly used temperatures and calibrations in Hertz. The values can be directly applied to Topsin (SR, spectral reference frequency) for calibration.
| NEO600 SR values for TopSpin | NEO850 SR values for TopSpin | |||||
| T (K) | 1H | 13C | 15N | 1H | 13C | 15N |
| 280 | -171.69 | -445.23 | -18.61 | -241.29 | -630.43 | -26.14 |
| 285 | -138.50 | -436.89 | -15.25 | -194.05 | -618.55 | -21.35 |
| 290 | -105.31 | -428.54 | -11.89 | -146.81 | -606.67 | -16.57 |
| 295 | -72.12 | -420.20 | -8.52 | -99.56 | -594.79 | -11.78 |
| 298 | -52.21 | -415.19 | -6.51 | -71.22 | -587.66 | -8.91 |
| 300 | -38.94 | -411.85 | -5.16 | -52.32 | -582.91 | -6.99 |
| 305 | -5.75 | -403.51 | -1.80 | -5.08 | -571.03 | -2.21 |
| 310 | 27.44 | -395.16 | 1.57 | 42.17 | -559.15 | 2.58 |
| 315 | 60.63 | -386.82 | 4.93 | 89.41 | -547.27 | 7.37 |
| 320 | 93.81 | -378.47 | 8.29 | 136.65 | -535.39 | 12.16 |
We use Poky or NMRFAM-Sparky more often then TopSpin for daily data analysis. In Poky or NMRFAM-Sparky, the calibration can be done by “st” command.
Note, values below are opposite signs ( + to – or – to +). I.e. TopSpin adds -72.12 Hz for NEO600 1H frequency at 295K, but Poky will add 0.12 ppm, not -0.12 ppm.
| NEO600 st values (ppm) for Poky | NEO850 st values (ppm) for Poky | |||||
| T (K) | 1H | 13C | 15N | 1H | 13C | 15N |
| 280 | 0.286 | 2.950 | 0.306 | 0.284 | 2.948 | 0.303 |
| 285 | 0.231 | 2.895 | 0.251 | 0.228 | 2.893 | 0.248 |
| 290 | 0.175 | 2.840 | 0.195 | 0.173 | 2.837 | 0.192 |
| 295 | 0.120 | 2.785 | 0.140 | 0.117 | 2.782 | 0.137 |
| 298 | 0.087 | 2.751 | 0.107 | 0.084 | 2.748 | 0.103 |
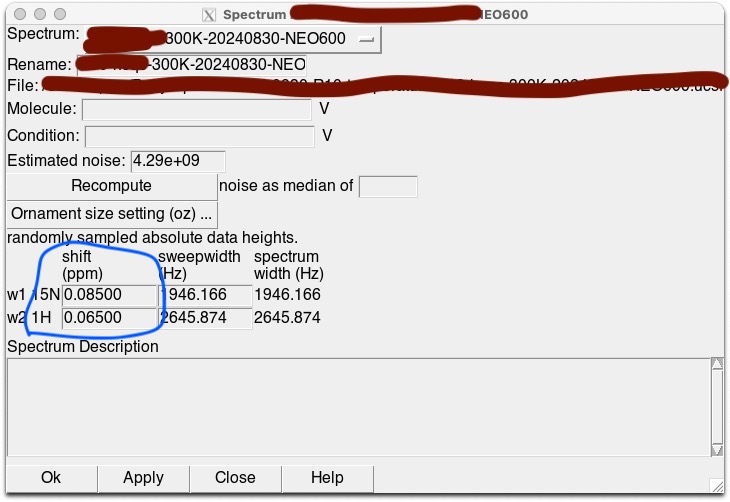
| 300 | 0.065 | 2.729 | 0.085 | 0.062 | 2.726 | 0.081 |
| 305 | 0.010 | 2.674 | 0.030 | 0.006 | 2.671 | 0.026 |
| 310 | -0.046 | 2.619 | -0.026 | -0.050 | 2.615 | -0.030 |
| 315 | -0.101 | 2.563 | -0.081 | -0.105 | 2.560 | -0.086 |
| 320 | -0.156 | 2.508 | -0.136 | -0.161 | 2.504 | -0.141 |
We thank Dr. Yuan-Chao Lou from the NMR facility of National Biotechnology Research Park for providing the 1 mM TSP-d4 (in 100% D2O) sample for the referencing experiments.
References:
NMR nomenclature. Nuclear spin properties and conventions for chemical shifts(IUPAC Recommendations 2001) https://doi.org/10.1351/pac200173111795
Further conventions for NMR shielding and chemical shifts (IUPAC Recommendations 2008)
https://doi.org/10.1351/pac200880010059
Use of Chemical Shifts in Macromolecular Structure Determination
Methods Enzymol . 2001:338:3-34.
https://doi.org/10.1016/S0076-6879(02)38214-4
