Here is the example using Bruker’s official pulse sequences to collect amide (NH) relaxation rates R1, R2 and heteronuclear NOE ratios.
| Expt | TopSpin “Par” | Relaxation parameter | Notes |
| T1 | std1_2D_15N-T1_ hsqct1etf3gptcwg3d | vdlist example: 10m, 400m, 600m, 50m, 100m, 800m, 200m, 1200m, 300m, 1000m, 700m, 150m | Do not exceed 1.2 second. F1 # = NBL (here is 12) |
| T2 | std1_2D_15N-T2_ hsqct2etf3gptcwg3d | vclist example: 1,2, 8, 4, 10, 6, 14, 13, 7, 12, 0, 5 | Do not exceed 250 ms. F1 # = NBL (here is 12) |
| hetNOE | std1_2D_15N-NOE_ hsqcnoef3gpsi | saturation time (d1): 4 seconds | TD1 (15N) is 2X |
Some details of experimental settings and data process:
- In hetNOE experiment, the TD1 (15N) should be 2X of one spectrum. For 2048×258, after split, it will be 2 spectra with 2048×128 time points.
- To split raw data, in TopSpin, use “rser2d” to extra individual raw data from pseuo3D T1 or T2 data.
- Use “split” in TopSpin to split reference and saturation spectra from heteronuclear NOE experiment.
- For T2 (R2) experiment, Bruker uses “loop” in vclist to control the relaxation time. The single loop time differs by NMR machines. The single loop time (d31) is 15.68ms for NEO850 and 17ms for NEO600.
- The advance using pseudo3D-typed interleaved T1 or T2 experiment is constant settings except for the vc or vd variables. No worries for typos between individual experiments.
- To run pseuo3D T1 or T2, randomize the vc and vd variables to avoid incremental heats by incremental loops.
- If time is allowed, repeat 1-2 relaxation time to improve curve fitting quality during analysis.
To analyze the relaxation rates (R1, R2), I suggested the “rh” function in Sparky. Just simply load the experiment and provide the relaxation time, then select peaks and type “rh”. Sparky will automatically fit and generate a table for you.
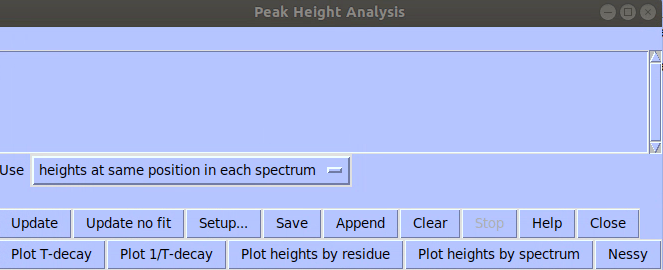
3 steps to get relaxation rates:
- In “rh” relaxation window, click “Setup”, choose the spectra, and provide the relaxation delays.
- Apply the setting and close the window.
- Choose the peaks (I used HSQC as a reference), and in Sparky, type “rh” to run fitting.
The fitting window will provide the peak intensity with many columns and rows. Like below
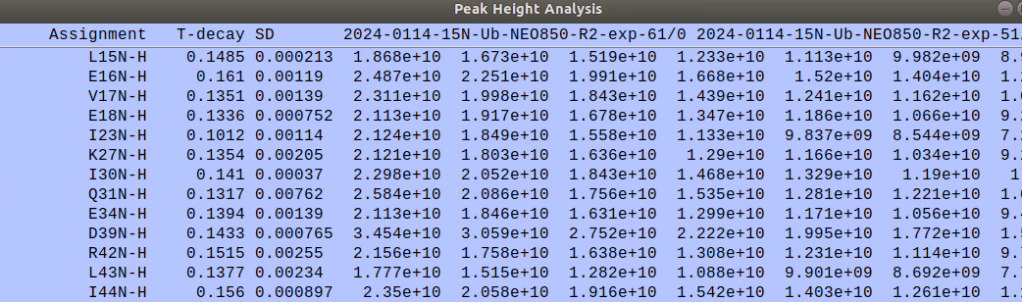
By clicking individual row, a pop-up window shows peak intensities and fitting curve.
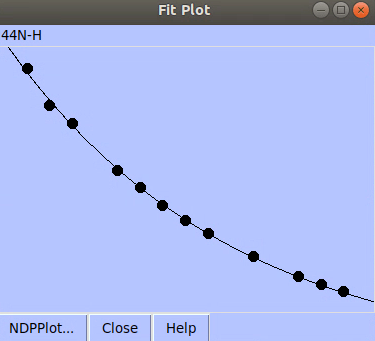
Sparky use the following formula for curve fitting
Y= a * exp(bx)
Converting to relaxation rates.
The default fitting provide the “T decays” not relaxation rates. To get the R1 or R2 rates, I do the following steps:
- (If the HSQC spectrum has been assigned) choose all peaks and run “rh” in Sparky.
- Save the fitting table.
- Run the following script (convert_T_to_R.tcsh) to convert T decay to R rate. This script keeps T values, error ranges of T decays, converted Rates and the proportional error ranges.
#!/bin/bash
#
# extract T1, T2 values and convert it to R1, R2
# 2024-0217, KP Wu
rm -f temp_*
echo "res T-value T-err R-value R-er" >temp_1
cat $1 |grep -v Assign\
|awk '{printf("%4s%8.4f%8.4f%8.4f%8.4f\n",$1,$2,$3,1/$2,($3/$2)/$2)}' \
|sed -e 's/N-H//g'|sed -e 's/[A-Z]//g' >>temp_1
mv temp_1 T-to-R.txt
cat T-to-R.txt
echo " "
echo "extracted, check T-to-R.txt"
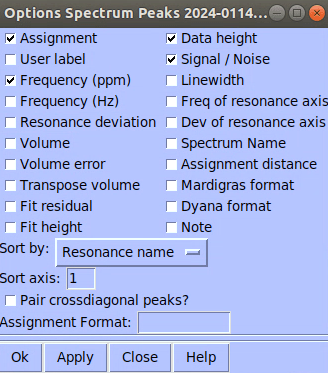
rm -f temp_*To calculate the heteronuclear NOE ratios, we have to obtain the peak intensities in the saturation and reference spectra in Sparky (command “lt”). Then calculate the ratio. The uncertainty of ratio is estimated as mentioned below (original post at UC Santa Barbara’s Chemistry NMR blog).
For peak A, the intensity is pA, the noise is ∆A, and the SNR is SNRA. (SNR = the peak signal-to-noise ratio )
- For peak ratio R (pA/pB), the deviation ∆R = (∆A*pB- pA*∆B)/pB2 = ∆A/pB – pA*∆B/pB2
- Alternatively, |∆R| = 1/SNRB + R/SNRB , where R = pA/pB
To get the by-residue ratios of heteronuclear NOEs, save the peak lists of two spectra (reference and saturation) separately. Then run the script below.
#!/bin/bash
#
# calculated peak ratios and uncertantity of peak ratios
# 2024-02-17
#
# reference UCSB Chem NMR website
# https://nmr.chem.ucsb.edu/protocols/SNR.html
# |dR| = (1/SNR_ref) + (sat/ref)/SNR_ref
#
# usage ./this_script saturate.list reference.list

rm temp_*
cat $1 |grep N-H |awk '{print $1,$4,$5}' >temp_sat
cat $2 |grep N-H |awk '{print $1,$4,$5}' >temp_ref
echo "res sat sat_snr ref ref_snr ratio r-err" >temp_ratio
paste temp_sat temp_ref \
	|awk '{print $1,$2,$3,$5,$6,$2/$5,(1/$6+(($2/$5)/$6))}' \
	|sed -e 's/N-H//g' |sed -e 's/[A-Z]//g'  >> temp_ratio
mv temp_ratio hetNOE-ratio.txt
cat hetNOE-ratio.txt
echo " "
echo "hetNOE ratios calculated, check hetNOE-ratio.txt"
rm temp_*
The “list” in Sparky format of the two spectra must contain information of “Data height” and “Signal / Noise” (see below snapshot). If more columns are provided, user has to adjust the script appropriately.